SWING TRADING
_________________________________________________________
What is Swing Trading?
Swing Trading takes advantage of brief price swings in strongly trending stocks to ride the momentum in the direction of the trend.
- Swing trading combines the best of two worlds -- the slower pace of investing and the increased potential gains of day trading.
- Swing traders hold stocks for days or weeks playing the general upward or downward trends.
- Swing Trading is not high-speed day trading. Some people call it momentum investing, because you only hold positions that are making major moves.
- By rolling your money over rapidly through short term gains you can quickly build up your equity.
How does Swing Trading work?
- The basic strategy of Swing Trading is to jump into a strongly trending stock after its period of consolidation or correction is complete.
- Strongly trending stocks often make a quick move after completing its correction which one can profit from.
- One then sells the stock after 2 to 7 days for a 5-25% move. This process can be repeated over and over again. One can also play the short side by shorting stocks that fall through support levels.
- In brief a Swing Trader's goal is to make money by capturing the quick moves that stocks make in their life span, and at the same time controlling their risk by proper money management techniques.
What are the advantages of Swing Trading?
- Swing Trading combines the best of two worlds -- the slower pace of investing and the increased potential gains of day trading.
- Swing Trading works well for part-time traders especially those doing it while at work. While day traders typically have to stay glued to their computers for hours at a time, feverishly watching minute-to-minute changes in quotes, swing trading doesn't require that type of focus and dedication.
- While Day Traders gamble on stocks popping or falling by fractions of points, Swing Traders try to ride "swings" in the market. Swing Traders buy fewer stocks and aim for bigger gains, they pay lower brokerage and, theoretically, have a better chance of earning larger gains.
- With day trading, the only person getting rich is the broker. "Swing traders go for the meat of the move while a day trader just gets scraps." Furthermore, to swing trade, you don't need sophisticated computer hook-ups or lightning quick execution services and you don't have to play extremely volatile stocks.
How to Swing Trade?
To fully understand what swing trading really is, you first need to understand what up/down trends are.
Up Trend: Simply put an uptrend is a series of higher highs and higher lows. In other words, an uptrend is a series of successive rallies that extend though previous high points, interrupted by declines which terminate above the low point of the preceding sell-off. Often the high of the last "swing" in the trend will serve as support for the next low. These areas are circled.
Down Trend: Simply put a downtrend is a series of lower highs and lower lows. In other words, a downtrend is a series of successive declines that extend though previous low points, interrupted by increases which terminate below the high point of the preceding rally. Often the low of the last "swing" in the stock's trend will serve as resistance for the next high. These are circled.
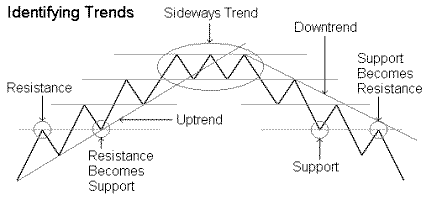
Long Swing Trades: Once an uptrend has been identified a swing trader looks for buying opportunities in that stock. This can be identified when the stock experiences a minor pullback or correction within that uptrend. The swing trader then activates a trailing buy-stop technique. If prices break out above the trailing stop loss, you will be stopped out and long in the trade. If prices decline, your buy-stop will not be touched.
Short Swing Trades: Once an downtrend has been identified a swing trader looks for selling opportunities in that stock. This can be identified when the stock experiences a minor rally within that downtrend. The swing trader then activates a trailing sell-stop technique. If prices break down and fall below the trailing stop loss, you will be stopped out on the short side. If prices rally, your sell-stop will not be touched.
Introduction to Swing Charting
With the strong trends exhibited by stocks, swing trading has become increasingly popular amongst traders. In fact, the swing chart is the most common technique used to identify trends. Here we look at how to draw swing charts, and, more importantly, how to use them to profit.
Why Use Swing Charts?
Swing charts are extremely useful tools for technical analysis, and here are some reasons why this technique is so popular:
Swing charts show nothing but trends, greatly simplifying the process of locating them. Remember, trends are the primary means to profit in any market!
Swing charts exhibit less market "noise," which can help you more accurately apply other forms of technical analysis that arent time sensitive.
There are several variations of this technique--such as Kagi charts and Gann-based swing charts--that offer a more complex way to locate trends. These techniques also offer the option of making many empirical changes to further enhance trend-finding abilities.
Constructing a Swing Chart
Swing charts, in their most basic form, are composed of price bars, which represent price behavior during a given time.
Here is a simple bar chart we will reference throughout this article:
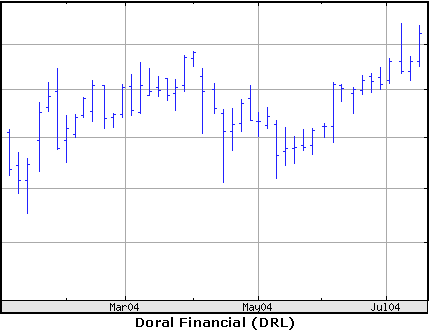
Most technical traders have probably seen a bar chart as it is the most common type of chart. The vertical lines represent the price range, and the left peg represents the opening price and the right peg represents the closing price during a given time period.
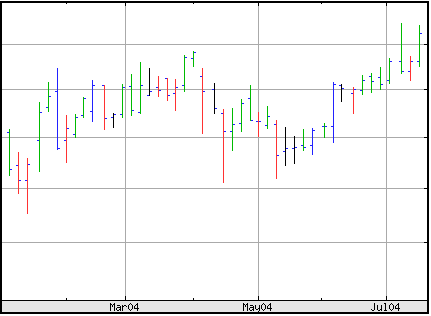
There are many different ways to construct a swing chart using highs and lows. For this article, we will focus on the popular and effective Gann swing charting method. Here are the four basic turning points in this type of chart:
Up day - Higher high and higher low (green).
Down day - Lower high and lower low (red).
Inside day - Lower high, and high low (black).
Outside day - Higher high, and lower low (blue).
Here is the same bar chart as above, classifying every bar as one of the four turning points:
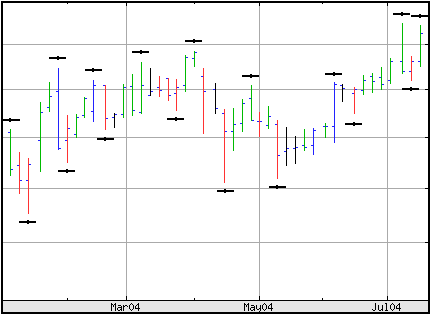
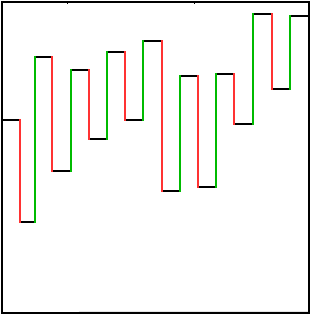
These two points indicate when a trend begins or ends and, as such, a time to enter or exit a swing trade. Now that we have marked these points, we can construct the actual swing chart. To do this, we first eliminate the time factor by moving the points together in equal intervals while maintaining the order. After this, simply connect all the points to complete the chart. The end product should look something like this:
Notice that the time factor has completely disappeared, and it is significantly easier to see price trends.
Using Swing Charts
Swing charts can be used in a variety of ways:
- To easily view the overall trend of a market or equity - Trends can be discerned by simply looking for progressively higher highs and lows (which form a stair-like pattern) or by drawing trend lines.
- To easily position "stop-loss" and "take profit" points - Previous highs can be used as take-profit points, and previous "step" bottoms throughout a trend can be used as moving stop-loss points.
- To apply technical analysis techniques that are not time sensitive - For example, Fibonacci levels can be calculated, or Elliott Waves can be applied. These can often help you predict where prices are headed, or can help you place more effective take-profit and stop-loss levels.
- To create price channels These can be developed by connecting consecutive highs and consecutive lows. This can help predict prices, place moving take-profit and stop-loss points, or help you liquidate or add to a position in a timely manner. Placing lines that connect highs to highs and another connecting lows to lows creates a channel through which the price moves.
Conclusion
Swing charts offer an easier way to view trends by removing market "noise" and the time factor. They can be used in conjunction with several forms of technical analysis to obtain more accurate predictions and take-profit and stop-loss points. There is an old market adage: "The trend is your friend." Swing charts can help you find it
by Justin Kuepper (investopedia.com)
We have now identified the beginnings and ends of several trends using the four different turnings points. To construct the swing chart, we must remove time as a factor and instead focus solely on price action. To do this, we must find two points:
- Up day that is followed by a down day.
- Down day that is followed by an up day.
Related Topics

----------- EDUCATION ---------
-------TRADING METHODS ------
--------- FOR TRADERS ---------
-------------- OTHER ------------

_________________________________________________________________________________________________________________________________________
Do you like fx1618?
If you think fx1618.com is cool and want to help fx1618, please tell your friends about it via email and blog (or forum)