ICHIMOKU
_________________________________________________________
Introduction to Ichimoku
- Quick Description
- History
- Equilibrium "At a Glance"
- Ichimoku Components
- Ichimoku Settings
The Five Lines of Ichimoku
- The Tenkan Sen
- The Kijun Sen
- The Chikou Span
- The Senkou Span A
- The Senkou Span B
The Kumo
- The Basics
- A Better Measure of Support and Resistance
- Price's Relationship to the Kumo
- Kumo Width
- Kumo Sentiment
- Flat Top/Bottom Kumos
Trend Trading
- Introduction
- Ichimoku Kinko Hyo and Trend Trading
---------------------------------------
Introduction to Ichimoku
Ichimoku Kinko Hyo is a purpose-built trend trading charting system that has been successfully used in nearly every tradeable market. It is unique in many ways, but its primary strength is its use of multiple data points to give the trader a deeper, more comprehensive view into price action. This deeper view, and the fact that Ichimoku is a very visual system, enables the trader to quickly discern and filter "at a glance" the low-probability trading setups from those of higher probability.
History
The charting system of Ichimoku Kinko Hyo was developed by a Japanese newspaper man named Goichi Hosoda. He began developing this system before World War II with the help of numerous students that he hired to run through the optimum formulas and scenarios - analogous to how we would use computer simulated backtesting today to test a trading system. The system itself was finally released to the public in 1968, after more than twenty years of testing, when Mr. Hosoda published his book which included the final version of the system.
Ichimoku Kinko Hyo has been used extensively in Asian trading rooms since Hosoda published his book and has been used successfully to trade currencies, commodities, futures, and stocks. Even with such wild popularity in Asia, Ichimoku did not make its appearance in the West until the 1990s and then, due to the utter lack of information in English on how to use it, it was mostly relegated to the category of another "exotic" indicator by the general trading public. Only now, in the early 21st century, are western traders really beginning to understand the power of this charting system.
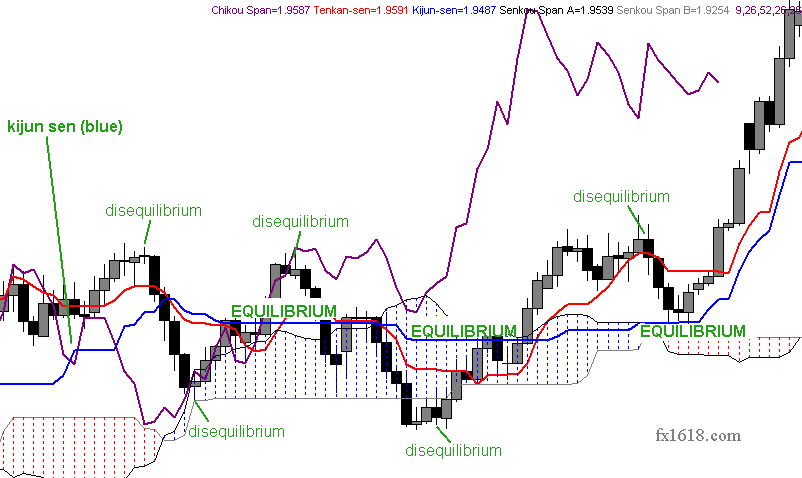
Equilibrium At a Glance
The name Ichimoku Kinko Hyo, which translates to "Equilibrium chart at a glance" aptly describes the system and how it is to be used, as described below:
While Ichimoku utilizes five separate lines or components, they are not to be used individually, in isolation, when making trading decisions, but rather used together to form an integrated "whole" picture of price action that can be gleaned "at a glance". Thus, a simple look at an Ichimoku chart should provide the Ichimoku practitioner with a nearly immediate understanding of sentiment, momentum and strength of trend.
Price action is constantly measured or gauged from the perspective of whether it is in relative equilibrium or disequilibrium. Hosoda strongly believed that the market was a direct reflection of human group dynamics or behavior. He felt that human behavior could be described in terms of a constant cyclical movement both away from and back towards equilibrium in their lives and interactions. Each of the five components that make up Ichimoku provide its own reflection of this equilibrium or balance.
Related Topics
FIGURE1 - Ichimoku Components
Ichimoku Settings
As you can see in the Ichimoku Components section above, each line calculation has one and sometimes two different settings based on the number of periods considered. After much research and backtesting, Goichi Hosoda finally determined that the settings of 9, 26 and 52 were the ideal settings for obtaining optimum results with Ichimoku. He derived the number 26 from what was then the standard Japanese business month (which included Saturdays). The number 9 represents a week and a half and the number 52 represents two months.
The standard settings for an Ichimoku Kinko Hyo chart are 9,26,52.
There is some debate around whether or not these settings of 9,26,52 are still valid given that the standard work month here in the West does not include Saturdays. In addition, in non-centralized markets that do not keep standard business hours like the Forex (which trades around the clock) some have posited that there may be more appropriate settings. Nevertheless, we at Boersma & Hunt, as well as most other professional Ichimoku traders, agree that the standard settings of 9,26,52 work extremely well and do not need to be altered.
The argument could be made that, since Ichimoku Kinko Hyo functions as a finely-tuned, integrated whole, changing the settings
to something other than the standard could throw the system out of balance and introduce invalid signals.
Thus, for the purposes of describing Ichimoku Kinko Hyo within this wiki, it will be assumed that the standard settings are being used
The Five Lines of Ichimoku
1 Tenkan Sen
2 Kijun Sen
3 Chikou Span
4 Senkou Span A
5 Senkou Span B
Tenkan Sen
The tenkan sen is calculated in the following manner:
TENKAN SEN ("turning line")
(HIGHEST HIGH + LOWEST LOW)/2 for the past 9 periods
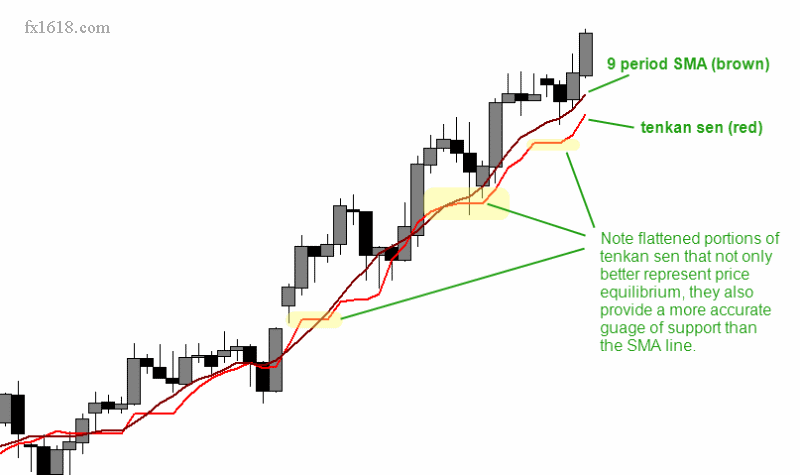
While many may compare the tenkan sen to a simple 9 period simple moving average (SMA), it is quite different in the sense that it measures the average of price's highest high and lowest low for the last 9 periods. Hosoda believed that using the average of price extremes over a given period of time was a better measure of equilibrium than merely using an average of the closing price. This study of the tenkan sen will provide us with our first foray into the key aspect of equilibrium that is so prevalent in the Ichimoku Kinko Hyo charting system
Consider the chart in Figure 2 below:
FIGURE 2 - Tenkan Sen vs. 9 Period SMA
As can be seen in the chart, the tenkan sen often exhibits "flattening" whereas the 9 period SMA does not. This is due to the fact that the tenkan sen uses the average of the highest high and lowest low rather than an average of the closing price. Thus, during periods of price ranging, the tenkan sen will clearly show the midpoint of the range via its flat aspect.
When the tenkan sen is flat, it essentially indicates a trendless condition over the last 9
periods.
It can also be seen how the tenkan sen provides a much more accurate level of price support than does the 9 period SMA. With only one exception, price action stayed above the tenkan sen in the three highlighted areas of the chart, while price broke below the SMA numerous times. This is due to the more conservative manner in which the tenkan sen is calculated, which makes it less reactive to small movements in price. On a bearish chart, the tenkan sen will likewise act as a level of resistance.
The angle of the tenkan sen can also give us an idea of the relative momentum of price movements over the last 9 periods. A steeply angled tenkan sen will indicate a nearly vertical price rise over a short period of time or strong momentum, whereas a flatter tenkan sen will indicate lower momentum or no momentum over that same time period.
The tenkan sen and the kijun sen both measure the shorter-term trend. Of the two, the tenkan sen is the "fastest" given that it measures trend over the past 9 periods as opposed to the kijun sen's 26 periods. Thus, given the very short term nature of the tenkan sen, it is not as reliable an indicator of trend as many other components of Ichimoku. Nevertheless, price breaching the tenkan sen can give an early indication of a trend change, though, like all Ichimoku signals, this should be confirmed by the other Ichimoku components before making any trading decision.
One of the primary uses of the tenkan sen is vis-a-vis its relation to the kijun sen. If the tenkan sen is above the kijun sen, then that is a bullish signal. Likewise, if the tenkan sen is below the kijun sen, then that is bearish. The crossover of these two lines is actually a trading signal on its own, at topic that is covered in more detail in our Ichimoku Trading Strategies section.
Kijun Sen
The kijun sen is calculated in the following manner:
KIJUN SEN ("standard line")
(HIGHEST HIGH + LOWEST LOW)/2 for the past 26 periods
The kijun sen is one of the true "workhorses" of Ichimoku Kinko Hyo and it has myriad applications. Like its brother, the tenkan sen, the kijun sen measures the average of price's highest high and lowest low, though it does so over a longer time frame of 26 periods as opposed to the tenkan sen's 9 periods. The tenkan sen thus provides us with all the information the tenkan sen does, just on a longer time frame.
Due to the longer time period it measures, the kijun sen is a more reliable indicator of short-term price sentiment, strength and equilibrium than the tenkan sen. If price has been ranging, then the kijun sen will reflect the vertical midpoint of that range (price equilibrium) via its flat aspect. Once price exceeds either the last highest high or lowest low within the last 26 periods, however, the kijun sen will reflect that by either angling up or down, respectively. Thus, short-term trend can be measured by the direction of the kijun sen. In addition, the relative angle of the kijun sen will indicate the strength or momentum of the trend.
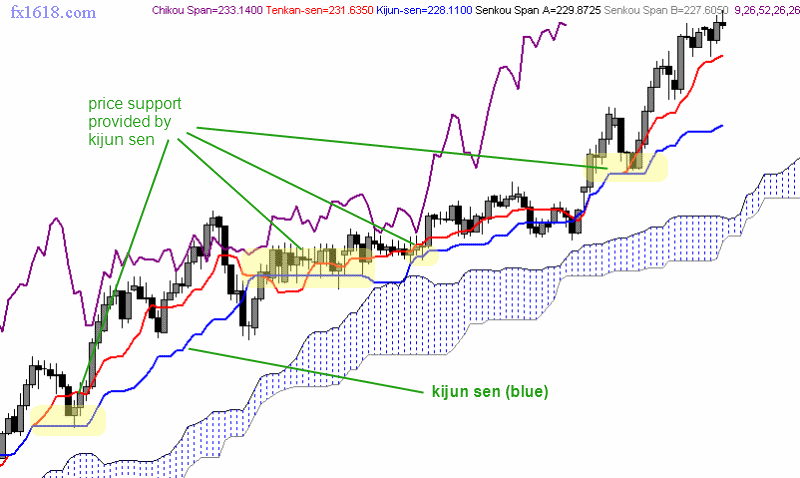
Price equilibrium is expressed even more accurately in the kijun sen than in the tenkan sen, given the longer period of time it considers. Thus, the kijun sen can be relied upon as a significant level of price support and resistance (see highlighted areas in Figure 3 below).
FIGURE 3 - Kijun Sen Support
Price tends to move alternately away from and back toward the kijun sen in a cyclical fashion due to the kijun sen's strong expression of equilibrium or stasis. Thus, when price momentum is extreme and price moves rapidly up or down over a short period of time, a certain "rubber band" effect can be observed on price by the kijun sen, attracting price back towards itself and bringing it back to equilibrium. An analogy could be made between how price interacts with the kijun sen and how electricity always seeks to return to ground or zero potential. The "ground" in this case is the kijun sen and price will always seek to return to that level. This phenomenon is particularly evident when the kijun sen is flat or trendless, as can be seen in Figure 4 below:
FIGURE 4 - Kijun Sen "Rubber Band" Effect
Given the dynamics of the kijun sen outlined above, traders can use the kijun sen effectively as both a low-risk point of entry as well as a solid stop loss. These two tactics are employed extensively in both the kijun sen cross as well as the tenkan sen/kijun sen cross strategies which are covered in greater detail in our Ichimoku Trading Strategies section.
Chikou Span
The chikou span is calculated in the following manner:
CHIKOU SPAN ("lagging line")
CURRENT CLOSING PRICE time-shifted backwards (into the past) 26 periods
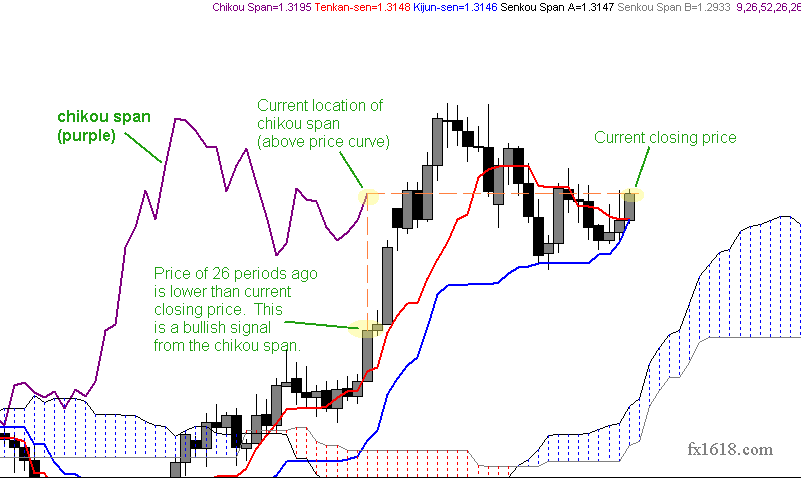
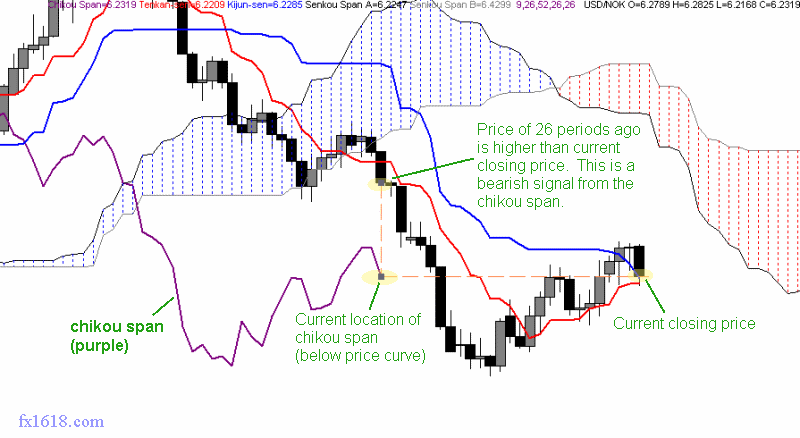
The chikou span represents one of Ichimoku's most unique features; that of time-shifting certain lines backwards or forwards in order to gain a clearer perspective of price action. In the chikou span's case, the current closing price is time-shifted backwards by 26 periods. While the rationale behind this may at first appear confusing, it becomes very clear once we consider that it allows us to quickly see how today's price action compares to the price action of 26 periods ago, which can help determine trend direction.
If the current close price (as depicted by the chikou span) is lower than the price of 26 periods ago, that would indicate that there is a potential for more bearish price action to come, since price tends to follow trends. Conversely, if the current closing price is above the price of 26 periods ago, that would then indicate the possibility for more bullish price action to follow.
Consider the charts in Figures 5 and 6 below:
FIGURE 5 - Chikou Span in Bullish Configuration
FIGURE 6 - Chikou Span in Bearish Configuration
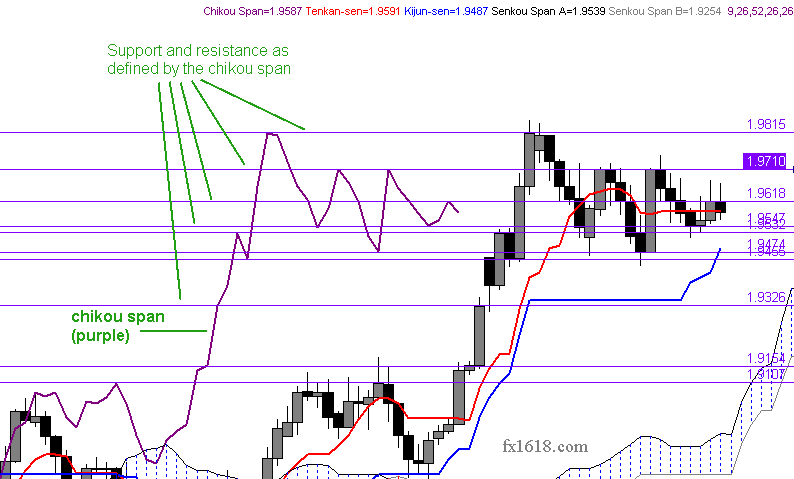
In addition to providing us with another piece of the "trend puzzle", the chikou span also provides clear levels of support and resistance, given that it represents prior closing prices. Ichimoku practitioners can thus draw horizontal lines across the points created by the chikou span to see these key levels and utilize them in their analysis and trading decisions (see Figure 7 below).
FIGURE 7 - Chikou Span Support and Resistance Levels
Senkou Span A
The senkou span A is calculated in the following manner:
SENKOU SPAN A ("1st leading line")
(TENKAN SEN + KIJUN SEN)/2 time-shifted forwards (into the future) 26 periods
The senkou span A is best-known for its part, along with the senkou span B line, in forming the kumo, or "Ichimoku cloud" that is the foundation of the Ichimoku Kinko Hyo charting system. The senkou span A is another one of the time-shifted lines that are unique to Ichimoku. In this case, it is shifted forwards by 26 periods. Since it represents the average of the tenkan sen and kijun sen, the senkou span A is itself a measure of equilibrium. Goichi Hosoda knew well that price tends to respect prior support and resistance levels, so by time-shifting this line forward by 26 periods he allowed the Ichimoku practitioner to quickly see "at a glance" where support and resistance from 26 periods ago (1 month ago on a Daily chart) reside compared with current price action.
While it is possible to trade off of the senkou span A and B lines on their own, their real power comes in their combined dynamics in the kumo.
Senkou Span B
The senkou span B is calculated in the following manner:
SENKOU SPAN B ("2nd leading line")
(HIGHEST HIGH + LOWEST LOW)/2 for the past 52 periods time-shifted forwards (into the future) 26 periods
The senkou span B is best-known for its part, along with the senkou span A line, in forming the kumo, or "Ichimoku cloud" that is the foundation of the Ichimoku Kinko Hyo charting system. On its own, the senkou span B line represents the longest-term view of equilibrium in the Ichimoku Kinko Hyo system. Rather than considering only the last 26 periods in its calculation like the senkou span A, the senkou span B measures the average of the highest high and lowest low for the past 52 periods. It then takes that measure and time-shifts it forward by 26 periods, just like the senkou span A. In Hosoda's original implementation, the senkou span B would thus represent price equilibrium for the prior two (2) month period, shifted ahead of current price by one (1) month. This convention allows Ichimoku practitioners to see this longer term measure of equilibrium ahead of current price action, allowing them to make informed trading decisions.
The kumo
The Basics
The kumo is the very "heart and soul" of the Ichimoku Kinko Hyo charting system. Perhaps the most immediately visible component of Ichimoku, the kumo ("cloud" in Japanese) enables one to immediately distinguish the prevailing "big picture" trend and price's relationship to that trend. The kumo is also one of the most unique aspects of Ichimoku Kinko Hyo as it provides a deep, multi-dimensional view of support and resistance as opposed to just a single, uni-dimensional level as provided by other charting systems. This more encompassing view better represents the way in which the market truly functions, where support and resistance is not merely a single point on a chart, but rather areas that expand and contract depending upon market dynamics.
The kumo itself is comprised of two lines, the senkou span A and the senkou span B. Each of these two lines provides its own measure of equilibrium and together they form the complete view of longer-term support and resistance. Between these two lines lies the kumo "cloud" itself, which is essentially a space of "no trend" where price equilibrium can make price action unpredictable and volatile.
Trading within the kumo is not a recommended practice, as its trendless nature creates a high degree of uncertainty.
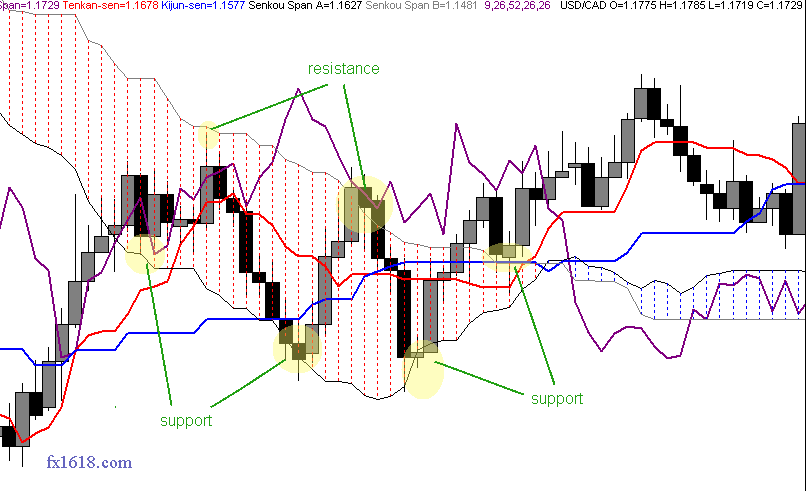
A Better Measure of Support and Resistance
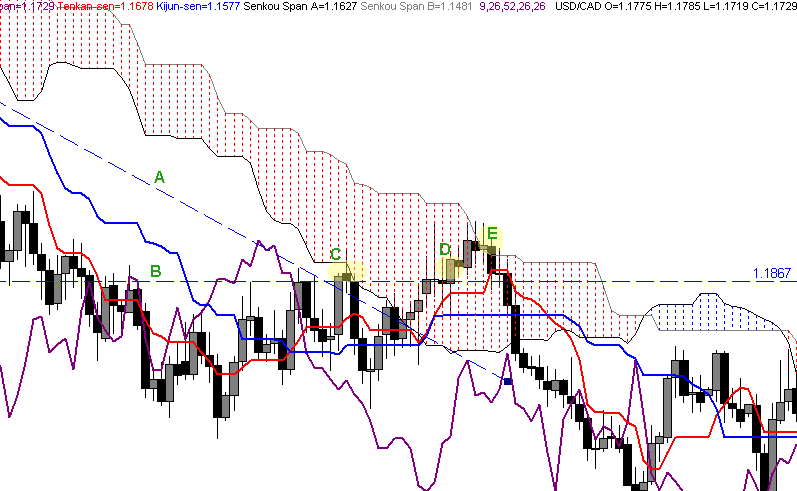
As mentioned earlier, one of the kumo's most unique aspects is its ability to provide a more reliable view of support and resistance than that provided by other charting systems. Rather than providing a single level for S&R, the kumo expands and contracts with historical price action to give a multi-dimensional view of support and resistance. At times the kumo's ability to forecast support and resistance is nothing short of eerie, as can be seen in the chart below (Figure 8) for USD/CAD, where price respected the kumo boundaries on five separate occasions over a 30-day span.
FIGURE 8
The power of the kumo becomes even more evident when we compare traditional support and resistance theory to Ichimoku's more comprehensive view of support and resistance via the kumo.
In the chart for Figure 9 below, we have added a traditional down trendline (A) and a traditional resistance line at 1.1867 (B). Price managed to break and close above both the down trendline and the single resistance level at point C. Traditional S&R traders would take this as a strong signal to go Long this pair at that point. A savvy Ichimoku practitioner, on the other hand, would take one look at price's location just below the bottom edge of the kumo and would know that going long at that point is extremely risky given the strong resistance presented by the kumo. Indeed, price did bounce off of the kumo and dropped approximately 250 pips, which would have most likely eradicated the long position of the traditional S&R trader.
Frustrated by his last losing trade, the traditional S&R trader spots another chance to go long, as he sees price break and close above the prior swing high at point D. The Ichimoku trader only sees price trading in the middle of the kumo, which he knows is a trendless area that makes for uncertain conditions. The Ichimoku trader is also aware that the top boundary of the kumo, the senkou span B, is close at hand and may present considerable resistance, so he again leaves this dubious long trade to the traditional S&R trader as he awaits a better trade opportunity. Lo and behold, after meeting the kumo boundary and making a meager 50 pips, the pair drops like a stone nearly 500 pips.
The example given above illustrates how Ichimoku's multi-dimensional view of support and resistance gives the Ichimoku practitioner an "inside view" of S&R that traditional chartists do not have. This enables the Ichimoku practitioner to select only the most legitimate, high reward trade opportunities and reject those of dubious quality and reward. The traditional chartist is left to "hope" that their latest breakout trade doesn't turn into a head fake - a shaky strategy, at best.
FIGURE 9
Price's Relationship to the Kumo
In its most basic interpretation, when price is trading above the kumo, that is a bullish signal since it indicates current price is higher than the historical average. Likewise, if price is trading below the kumo, that indicates that bearish sentiment is stronger. If price is trading within the kumo, that indicates a loss of trend since the space between the kumo boundaries is the ultimate expression of equilibrium or stasis. The informed Ichimoku practitioner will normally first consult price's relationship to the kumo in order to get their initial view on a chart's sentiment. From a trading perspective, the Ichimoku chartist will also always wait for price to situate itself on the correct side of the kumo (above for long trades and below for short trades) on their chosen execution time frame before initiating any trades. If price is trading within the kumo, then they will wait to make any trades until it closes above/below the kumo.
Kumo Depth
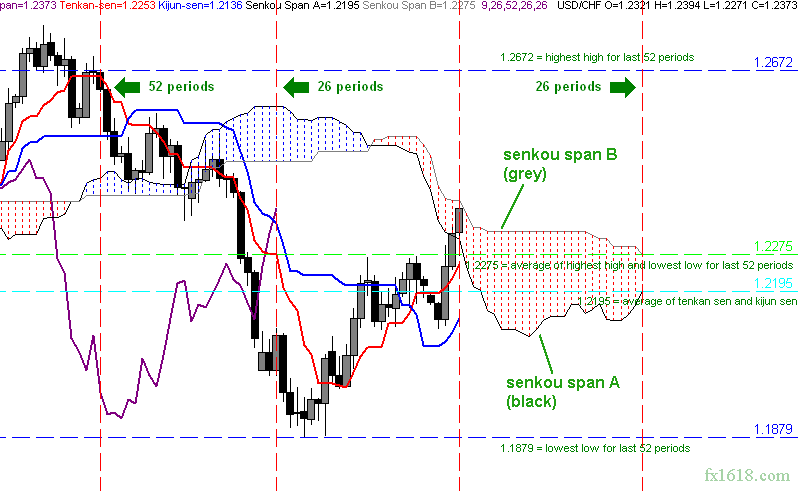
As you will see upon studying an Ichimoku chart, the kumo's depth or thickness can vary drastically. The depth of the kumo is an indication of market volatility, with a thicker kumo indicating higher historical volatility and a thinner one indicating lower volatility. To understand this phenomenon, we need to keep in mind what the two lines that make up the kumo, the senkou span A and the senkou span B, represent. The senkou span A measures the average of the tenkan sen and kijun sen, so its "period" is between 9 and 26 periods, since those are the two periods that the Tenkan Sen and Kijun Sen measure, respectively. The senkou span B line, on the other hand, measures the average of the highest high and lowest low price for the past 52 periods. Thus, the Senkou Span A is essentially the "faster" line of the two, since it measures a shorter period of equilibrium.
Consider the chart in Figure 10 below. For the previous 52 periods, price made a total range of 793 pips (from a high of 1.2672 to a low of 1.1879) The midpoint or average of this range is 1.2275 and that is thus the value of the senkou span B. This value is then time-shifted forwards by 26 periods so that it stays in front of current price action. The senkou span A is more reactive to short-term price action and thus is already reflecting the move of price back up from its low of 1.1879 in its positive angle and the gradually thinning kumo. The senkou span B, on the other hand, is actually continuing to move down as the highest high of the last 52 periods continues to lower as it follows the price curve's move down from the original high of 1.2672. If price continues to rise, the senkou span A and B will switch places and the senkou span A will cross above the senkou span B in a so-called "kumo twist".
FIGURE 10
The kumo expands and contracts based on market volatility. With greater volatility (i.e. where the price of a given currency pair changes direction dramatically over a short period of time), the faster senkou span A will travel along in relative uniformity with the price curve while the slower senkou span B will lag significantly given that it represents the average of the highest high and lowest low over the past 52 periods. Thicker kumos are thus created when volatility increases and thinner ones are created when volatility decreases.
Kumo depth or thickness is a function of price volatility
From a trading perspective, the thicker the kumo, the greater support/resistance it will provide. This information can be used by the Ichimoku practitioner to fine tune their risk management and trading strategy. For example, they may consider increasing their position size if their Long entry is just above a particularly thick kumo, as the chances of price breaking back below the kumo is significantly less than if the kumo were very thin. In addition, if they are already in a position and price is approaching a very well-developed kumo on another time frame, they may choose to either take profit at the kumo boundary or at least reduce their position size to account for the risk associated with the thicker kumo.
In general, the thicker and more well-developed a kumo is, the greater the support/resistance it will provide.
Kumo Sentiment
In addition to providing a view of sentiment vis-a-vis its relationship with price, the kumo itself also has its own "internal" sentiment or bias. This makes sense when we consider that the kumo is made up of essentially two moving averages, the senkou span A and the senkou span B. When the senkou span A is above the senkou span B, the sentiment is bullish since the faster moving average is trading above the slower. Conversely, when the senkou span B is above the senkou span A, the sentiment is bearish.
This concept of kumo sentiment can be seen in Figure 11 below:
Figure 11
When the senkou span A and B switch places this indicates an overall trend change from this longer-term perspective. Ichimoku practitioners thus keep an eye on the leading kumo's sentiment for clues about both current trend as well as any upcoming trend changes. The "senkou span cross" is an actual trading strategy that utilizes this kumo twist as both an entry as well as a continuation or confirmation signal. More on this strategy is covered in our Ichimoku Trading Strategies section.
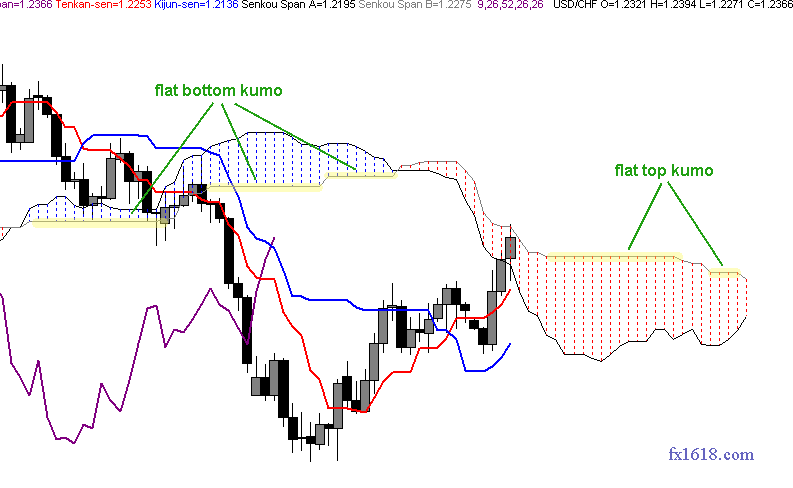
Flat Top/Bottom Kumos
The flat top or bottom that is often observed in the kumo is key to understanding one piece of the kumo's "equilibrium equation". Just like the "rubber band effect" that a flat kijun sen can exert on price, a flat senkou span B can act in the same way, attracting price that is in close proximity. The reason for this is simple: a flat senkou span B represents the midpoint of a trendless price situation over the prior 52 periods - price equilibrium. Since price always seeks to return to equilibrium, and the flat senkou span B is such a strong expression of this equilibrium, it becomes an equally strong attractor of price.
In a bullish trend, this flat senkou span B will result in a flat bottom kumo and in a bearish trend it will manifest as a flat top kumo. The Ichimoku practitioner can use this knowledge of the physics of the flat senkou span B in order to be more cautious about both their exits out of the kumo. For instance, when exiting a flat bottom (bullish) kumo from the bottom, rather than merely placing an entry order 10 pips below the senkou span B, savvy Ichimoku practitioners will look for another point around which to build their entry order to ensure they don't get caught in the flat bottom's "gravitational pull". This method minimizes the number of false breakouts experienced by the trader.
See the highlighted areas in the chart for Figure 12 below for an example of flat top and bottom kumos:
Figure 12
Trend trading
"Trend following is an investment strategy that takes advantage of long-term moves that play out in various markets... Traders who use this approach can use current market price calculation, moving averages and channel breakouts to determine the general direction of the market and to generate trade signals. This approach is reactive, diversified, long-term, and systematic by nature. Traders who subscribe to a trend following strategy do not aim to forecast or predict markets or price levels; they simply jump on the trend and ride it."
Ichimoku Kinko Hyo and Trend Trading
It must be understood by any who wishes to use the power of Ichimoku Kinko Hyo that it is, first and foremost, a trend trading system. It is further assumed that the trader wielding Ichimoku does so with a solid undertanding of the basic tenets of trend trading. This is a key assumption, since knowledge of how to trade the trend is absolutely critical to long-term success with Ichimoku. Ichimoku on its own will not teach one the underlying philosophy of trend following, so we must make a special mental note at this point regarding the key factors involved in successful trend trading.
Trend traders:
- NEVER attempt to predict where the market will go
- NEVER attempt to pick "tops" and "bottoms" of price action
- ALWAYS respect the trend and align their trades accordingly
- Let the market tell them when the trend is finished, not their "intuition"
- Realize that they will necessarily sacrifice some pips at the beginning and end of a trend as they wait for confirmation that the trend beginning and end are authentic
- Look at price action from a long-term perspective and don't get shaken by volatility
- Understand that they will go through some potentially significant but temporary periods of drawdown as the trend matures
- Understand that trend trading can lead to large gains but also equally large losses
- Understand that trends can take place on multiple time frames
Profitable trend trading is 99% mental. If one can conquer their mind and quell the inevitable inner dialogue that screams "Whoa! Looks like price is going against your position! The trend must be ending - SELL NOW!!" and keep their eyes on the long term, they stand an excellent chance at being a successful, happy and stress-free trend trader. However, if they cannot turn off this inner dialogue or at least ignore it and keep their focus on the long-term, then they are in for a very short, very bumpy ride as a Forex trader.
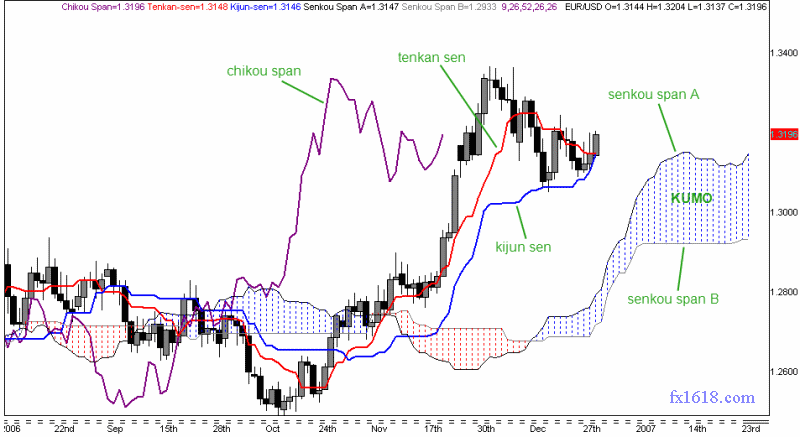

Ichimoku Components
The Ichimoku chart is composed of five (5) separate indicator lines. These lines work together to form the complete "Ichimoku picture". A summary of how each line is calculated is outlined below:
TENKAN SEN ("turning line")
(HIGHEST HIGH + LOWEST LOW)/2 for the past 9 periods
KIJUN SEN ("standard line")
(HIGHEST HIGH + LOWEST LOW)/2 for the past 26 periods
CHIKOU SPAN ("lagging line")
CURRENT CLOSING PRICE time-shifted backwards (into the past) 26 periods
SENKOU SPAN A ("1st leading line")
(TENKAN SEN + KIJUN SEN)/2 time-shifted forwards (into the future) 26 periods
SENKOU SPAN B ("2nd leading line")
(HIGHEST HIGH + LOWEST LOW)/2 for the past 52 periods time-shifted forwards (into the future) 26 periods
The senkou span A and B deserve special mention here as they, together, form the Ichimoku "kumo" or cloud. We cover the kumo and its myriad functions in more detail in the section "The kumo".
The chart below (FIGURE I) provides a visual representation of each of these five components:

----------- EDUCATION ---------
-------TRADING METHODS ------
--------- FOR TRADERS ---------
-------------- OTHER ------------

_________________________________________________________________________________________________________________________________________
Do you like fx1618?
If you think fx1618.com is cool and want to help fx1618, please tell your friends about it via email and blog (or forum)