DOW THEORY
_________________________________________________________
The ideas of Charles Dow, the first editor of the Wall Street Journal, form the basis of technical analysis today.
Dow created the Industrial Average, of top blue chip stocks, and a second average of top railroad stocks (now the Transport Average). He believed that the behavior of the averages reflected the hopes and fears of the entire market. The behavior patterns that he observed apply to markets throughout the world.
Dow Theory
Three Movements
Markets fluctuate in more than one time frame at the same time:
Nothing is more certain than that the market has three well defined movements which fit into each other.
- The first is the daily variation due to local causes and the balance of buying and selling at that particular time (Ripple).
- The secondary movement covers a period ranging from days to weeks, averaging probably between six to eight weeks (Wave).
- The third move is the great swing covering anything from months to years, averaging between 6 to 48 months. (Tide).
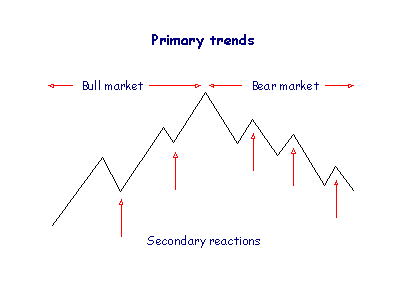
- Bull markets are broad upward movements of the market that may last several years, interrupted by secondary reactions. Bear markets are long declines interrupted by secondary rallies. These movements are referred to as the primary trend.
- Secondary movements normally retrace from one third to two thirds of the primary trend since the previous secondary movement.
- Daily fluctuations are important for short-term trading, but are unimportant in analysis of broad market movements.
Various cycles have subsequently been identified within these broad categories.
Dow Theory
Primary Movements have Three Phases
Look out for these general conditions in the market:
Bull markets
- Bull markets commence with reviving confidence as business conditions improve.
- Prices rise as the market responds to improved earnings
- Rampant speculation dominates the market and price advances are based on hopes and expectations rather than actual results.
Bear markets
- Bear markets start with abandonment of the hopes and expectations that sustained inflated prices.
- Prices decline in response to disappointing earnings.
- Distress selling follows as speculators attempt to close out their positions and securities are sold without regard to their true value.
Ranging Markets
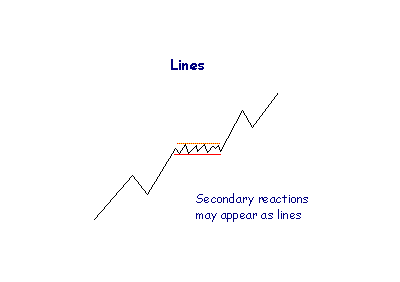
- A secondary reaction may take the form of a line which may endure for several weeks.
- Price fluctuates within a narrow range of about five per cent.
Breakouts from a range can occur in either direction.
- Advances above the upper limit of the line signal accumulation and higher prices;
- Declines below the lower limit indicate distribution and lower prices;
- Volume is used to confirm price breakouts.
Dow Theory
Trends
Bull Trends
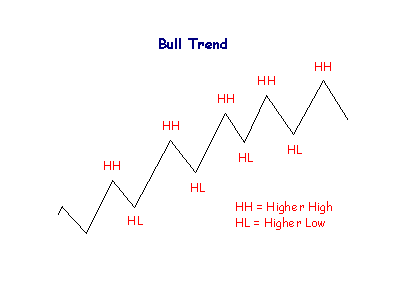
A bull trend is identified by a series of rallies where each rally exceeds the highest point of the previous rally. The decline, between rallies, ends above the lowest point of the previous decline.
Successive higher highs and higher lows.
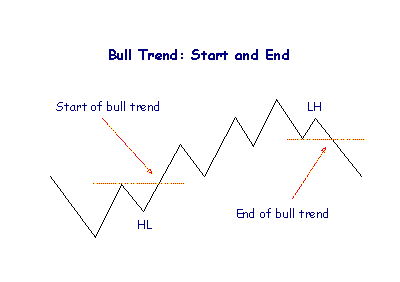
The start of an up trend is signaled when price makes a higher low (trough), followed by a rally above the previous high (peak):
Start = higher Low + break above previous High.
The end is signaled by a lower high (peak), followed by a decline below the previous low (trough):
End = lower High + break below previous Low.
What if the series of higher Highs and higher Lows is first broken by a lower Low? There are two possible interpretations - see Large Corrections.
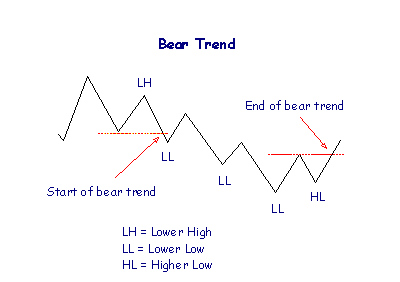
Bear Trends
Each successive rally fails to penetrate the high point of the previous rally. Each decline terminates at a lower point than the preceding decline.
Successive lower highs and lower lows.
A bear trend starts at the end of a bull trend: when a rally ends with a lower peak and then retreats below the previous low. The end of a bear trend is identical to the start of a bull trend.
What if the series of lower Highs and lower Lows is first broken by a higher High? This is a gray area - see Large Corrections.
Dow Theory
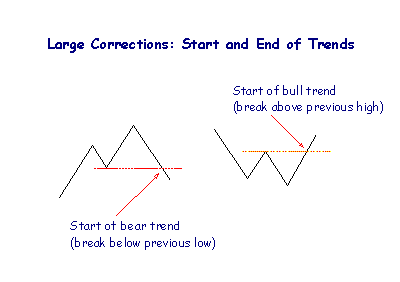
Large Corrections
A large correction occurs when price falls below the previous low (during a bull trend) or where price rises above the previous high (in a bear trend).
Some purists argue that a trend ends if the sequence of higher highs and higher lows is broken. Others argue that a bear trend has not started until there is a lower High and Low nor has a bull trend started until there is a higher Low and High.
For practical purposes: Only accept large corrections as trend changes in the primary trend:
- A bull trend starts when price rallies above the previous high,
- A bull trend ends when price declines below the previous low,
- A bear trend starts at the end of a bull trend (and vice versa).
Related Topics

----------- EDUCATION ---------
-------TRADING METHODS ------
--------- FOR TRADERS ---------
-------------- OTHER ------------

_________________________________________________________________________________________________________________________________________
Do you like fx1618?
If you think fx1618.com is cool and want to help fx1618, please tell your friends about it via email and blog (or forum)