Reversal Chart Patterns:
Head and Shoulders and Inverted Head and Shoulders
Price chart analysis starts with chart patterns. When you track price movements you may often see that these movements have predictable configurations, which are called chart patterns. Chart patterns are tools used to predict trend reversal or trend continuation.
Let's begin with chart reversal patterns - "Head and Shoulders" and "Inverted Head and Shoulders".
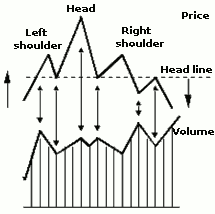
"Head and Shoulders" is the most recognizable reversal pattern. "Head and Shoulders" pattern appears at the end of a bullish trend:
TECHICAL ANALYSIS
_________________________________________________________
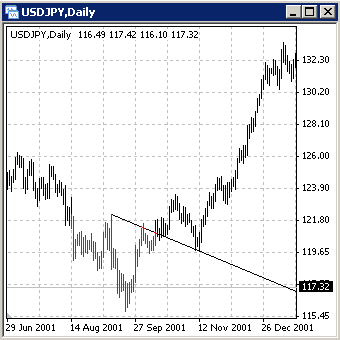
"Inverted Head and Shoulders" is the first sign that a bearish trend is about to end
Inverted chart patterns have distinct highs (bottoms). Head Line is a trend line which joins two bottoms between highs (two highs between two bottoms if the pattern is inverted).
Pattern characteristics:
- if on the bearish trend there is an "Inverted Head and Shoulders" pattern, then the higher the Right Shoulder the stronger the signal;
- if on the bullish trend the Right Shoulder of the "Head and Shoulders" pattern is higher than the left one, then this makes the signal stronger;
- in order to define if the pattern is valid, the volume pattern must also meet fairly strict requirements.
Once the Head Line has been broken, it is time to open a position. The best time to make a deal is when the level has been broken and the price rebounds to the Head Line.

"Inverted Head and Shoulders" pattern in MetaTrader

----------- EDUCATION ---------
-------TRADING METHODS ------
--------- FOR TRADERS ----------
-------------- OTHER ------------

_________________________________________________________________________________________________________________________________________

