Continuation Chart Patterns:
Flags, Pennants, Wedges and Rectangles
The Flag
Flags are usually preceded by a sharp advance or decline. The flag looks like a rectangle directed against the prevailing trend:
TECHICAL ANALYSIS
_________________________________________________________
The formation of this pattern is accompanied by a decrease in volume followed by a sharp increase after the breakout. The formation takes from 5 to 15 bars. The pattern is considered to be in the middle of the trend, so after the breakout the price may move the same range as it had moved before the pattern.
The Pennant
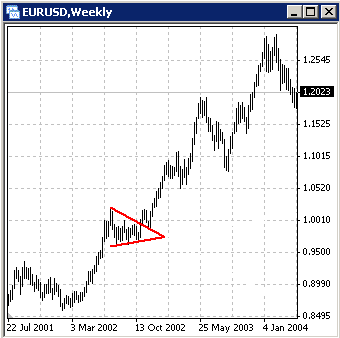
The pennant resembles a small symmetrical triangle:

The pattern occurs after a rapid trend, as a rule, in the middle of the trend. While the pennant is forming the volume decreases and then increases sharply after the breakout. 5 to 15 bars are required to form this model.
The Wedge
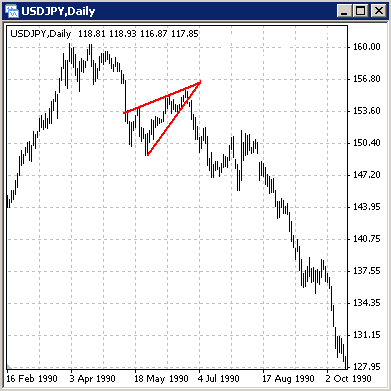
The wedge is a small triangle inclined against the trend:
Typically, like the flag, both the pattern's upper and lower edges are either going up (bearish formation) or down (bullish formation). Breakout tends to happen between 2/3 and 1 of the way through the pattern, and chances of a reversal are great if the pattern inclines along with the trend.
The Rectangles
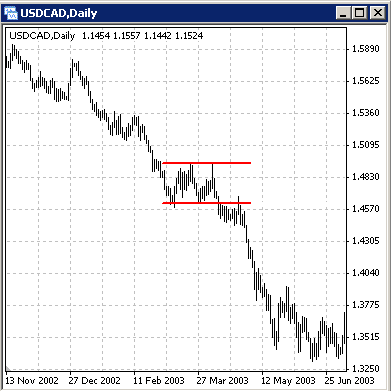
The rectangle looks like the Triple Top / Bottom:
In order to define what kind of pattern has been formed ("Rectangle" or "Triple Top / Bottom") use oscillatory and volume analyses. After the breakout, the price usually moves a range not less than the rectangle's height. Further edges of the rectangle will be support/resistance levels.


----------- EDUCATION ---------
-------TRADING METHODS ------
--------- FOR TRADERS ----------
-------------- OTHER ------------

_________________________________________________________________________________________________________________________________________

